Another Thanksgiving has come and gone and I have new data from this year’s 16 lb bird to add to the last time I updated this post.
An unexpected update problem was that the googlesheets package has been updated to googlesheets4 with new methods. I was able to figure out how to use the methods in blogdown and it opened a browser tab for me to authenticate. However it did so every time, so when I went to knit the actual HTML page, it hung, probably because I was not able to authenticate via the browser. There’s probably some way around this, but it was too much effort to figure out so I just downloaded the data as a csv file.
library(ggplot2)
suppressPackageStartupMessages(library(dplyr))
turkey_data <- read.csv("../datasets/Turkey_temp_2019.csv")
I was able to plot the temperature curve this year and compare to the prior years. Apparently I was not as good as taking data this year so there are many fewer points than prior years.
turkey_data$Year <- as.factor(turkey_data$Year)
ggplot(turkey_data, aes(x=Minutes, y = Bird_temp, shape = Year,
                   color = Year)) +
  geom_point() +
  ggtitle("Turkey Temperature")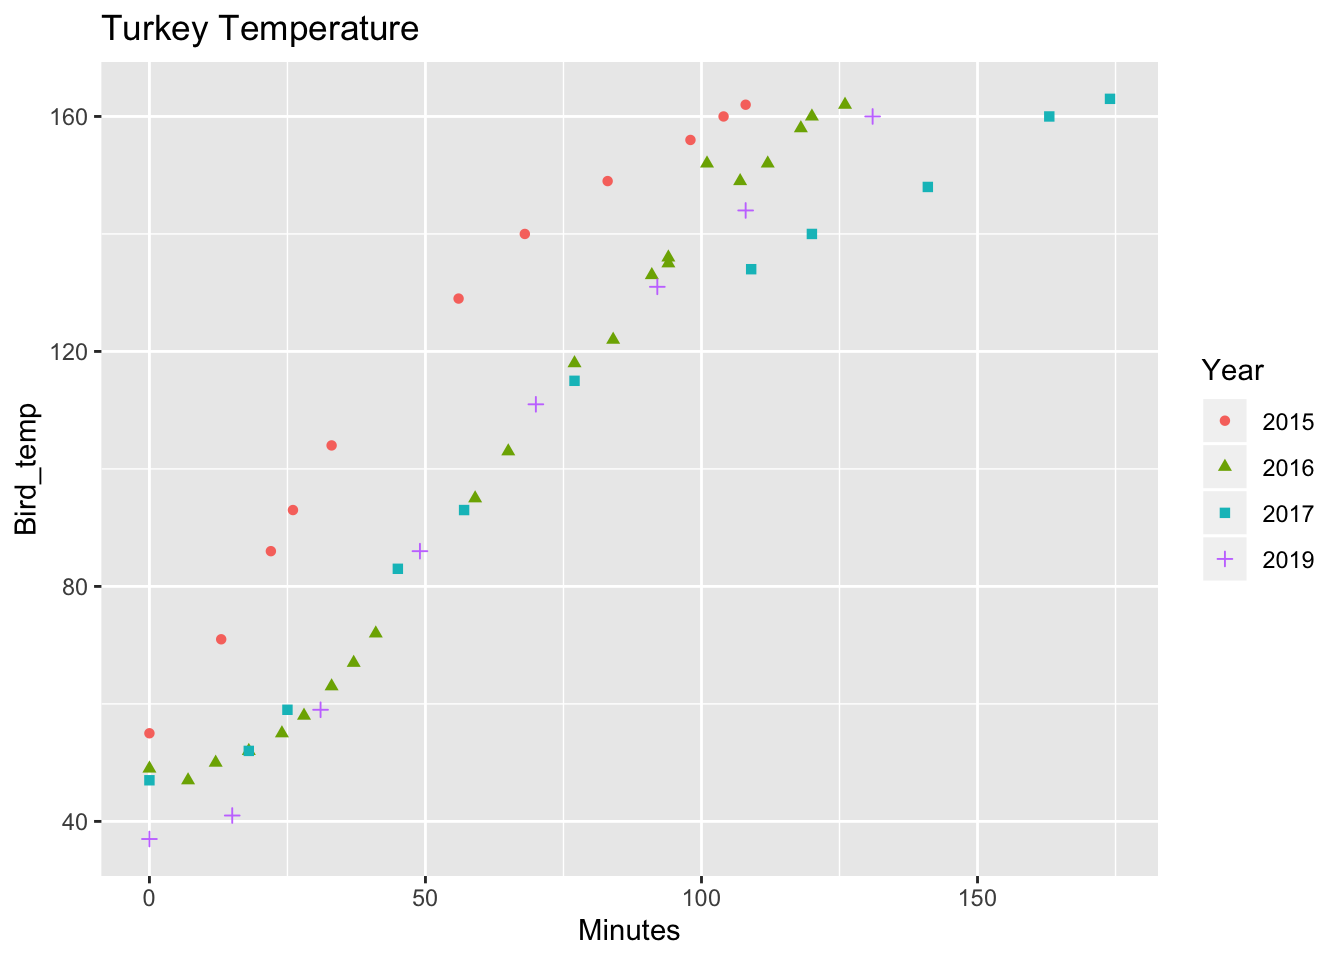
This was the first year I made a 16 lb bird. The ones from 2015 and 2016 were 14 lbs. In 2017 I had a 20 lb turkey.
This year’s turkey started at a lower temperature. In prior years I put the turkey in a bag inside a 5 gallon bucket with ice and brine. This year I put it in a bag inside a cooler and surrounded it with a few small bags of ice from the gas station. This method seemed to keep the turkey cooler longer.